Profiling
Profiling is to find out where your code spends its time. Profilers can collect several types of information: timing, function calls, interruptions or cache faults. It can be useful to identify bottlenecks, which should be the first step when trying to optimize some code, or to study the evolution of the performance of your code.
Profiling types⚑
There are two types of profiling:
- Deterministic Profiling
- All events are monitored. It provides accurate information but has a big impact on performance (overhead). It means the code runs slower under profiling. Its use in production systems is often impractical. This type of profiling is suitable for small functions.
- Statistical profiling
- Sampling the execution state at regular intervals to compute indicators. This method is less accurate, but it also reduces the overhead.
Profiling tools⚑
The profiling tools you should use vary with the code you are working on. If you are writing a single algorithm or a small program, you should use a simple profiler like cProfile or even a fine-grained tool like line_profiler. In contrast, when you are optimizing a whole program, you may want to use a statistical profiler to avoid overhead, such as pyinstrument, or if you're debugging a running process, using py-spy.
Deterministic Profiling⚑
cProfile⚑
Python comes with two built-in modules for deterministic profiling: cProfile and profile. Both are different implementations of the same interface. The former is a C extension with relatively small overhead, and the latter is a pure Python module. As the official documentation says, the module profile would be suitable when we want to extend the profiler in some way. Otherwise, cProfile is preferred for long-running programs. Unfortunately, there is no built-in module for statistical profiling, but we will see some external packages for it.
$: python3 -m cProfile script.py

58 function calls in 9.419 seconds

Ordered by: standard namen

calls  tottime  percall  cumtime  percall filename:lineno(function)
   1    0.000    0.000    9.419    9.419 part1.py:1(<module>)
   51   9.419    0.185    9.419    0.185 part1.py:1(computation)
   1    0.000    0.000    9.419    9.419 part1.py:10(function1)
   1    0.000    0.000    9.243    9.243 part1.py:15(function2)
   1    0.000    0.000    0.176    0.176 part1.py:20(function3)
   1    0.000    0.000    9.419    9.419 part1.py:24(main)
Where:
- ncalls
- Is the number of calls. We should try to optimize functions that have a lot of calls or consume too much time per call.
- tottime
- The total time spent in the function itself, excluding sub calls. This is where we should look closely at. We can see that the function computation is called 51 times, and each time consumes 0.185s.
- cumtime
- Cumulative time. It includes sub calls.
- percall
- We have two “per call” metrics. The first one: total time per call, and the second one: cumulative time per call. Again, we should focus on the total time metric.
We can also sort the functions by some criteria, for example python3 -m cProfile -s tottime script.py.
Statistical profiling⚑
Py-spy⚑
Py-Spy is a statistical (sampling) profiler that lets you visualize the time each function consumes during the execution. An important feature is that you can attach the profiler without restarting the program or modifying the code, and has a low overhead. This makes the tool highly suitable for production code.
To install it, just type:
pip install py-spy
To test the performance of a file use:
py-spy top python3 script.py
To assess the performance of a runnin process, specify it's PID:
py-spy top --pid $PID
They will show a top like interface showing the following data:
GIL: 100.00%, Active: 100.00%, Threads: 1

  %Own   %Total  OwnTime  TotalTime  Function (filename:line)
 61.00%  61.00%   10.50s    10.50s   computation (script.py:7)
 39.00%  39.00%    7.50s     7.50s   computation (script.py:6)
  0.00% 100.00%   0.000s    18.00s   <module> (script.py:30)
  0.00% 100.00%   0.000s    18.00s   function2 (script.py:18)
  0.00% 100.00%   0.000s    18.00s   main (script.py:26)
  0.00% 100.00%   0.000s    18.00s   function1 (script.py:12)
pyinstrument⚑
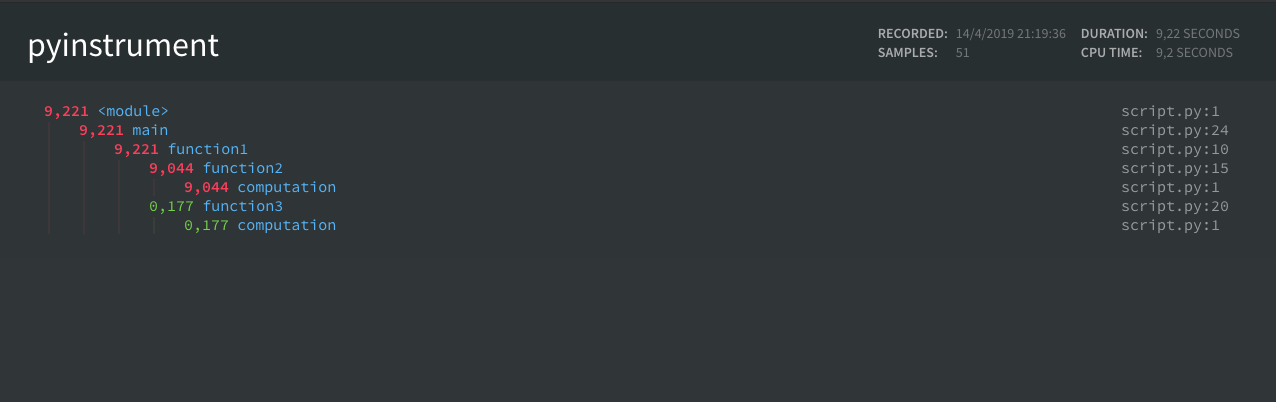
It is similar to cProfile in the sense that we can’t attach the profiler to a running program, but that is where the similarities end, as pyinstrument doesn't track every function call that your program makes. Instead, it's recording the call stack every 1ms.
Install it with:
pip install pyinstrument
Use:
The advantages are that:
- The output is far more attractive.
- It has less overhead, so it distorts less the results.
- Doesn't show the internal calls that make cProfiling result reading difficult.
- It uses wall-clock time instead of CPU time. So it takes into account the IO time.
$: pyinstrument script.py

  _     ._   __/__   _ _  _  _ _/_   Recorded: 15:45:20  Samples:  51
 /_//_/// /_\ / //_// / //_'/ //     Duration: 4.517     CPU time: 4.516
/   _/                      v3.3.0

Program: script.py

4.516 <module>  script.py:2
└─ 4.516 main  script.py:25
   └─ 4.516 function1  script.py:11
      ├─ 4.425 function2  script.py:16
      │  └─ 4.425 computation  script.py:2
      └─ 0.092 function3  script.py:21
         └─ 0.092 computation  script.py:2
With the possibility to generate an HTML report.
The disadvantages are that it's only easy to profile python script files, not full packages.
You can also profile a chunk of code, which can be useful when developing or for writing performance tests.
from pyinstrument import Profiler

profiler = Profiler()
profiler.start()

# code you want to profile

profiler.stop()

print(profiler.output_text(unicode=True, color=True))
To explore the profile in a web browser, use profiler.open_in_browser(). To save this HTML for later, use profiler.output_html().
Introduce profiling in your test workflow⚑
I run out of time, so here are the starting points:
- Niklas Meinzer post
- Pypi page of pytest-benchmark, Docs, Git
- Docs of pytest-profiling
- uwpce guide on using pstats
The idea is to develop the following ideas:
- How to integrate profiling with pytest.
- How to compare benchmark results between CI runs.
- Some guidelines on writing performance tests
And memray looks very promising.