Architecture
Prometheus Server⚑
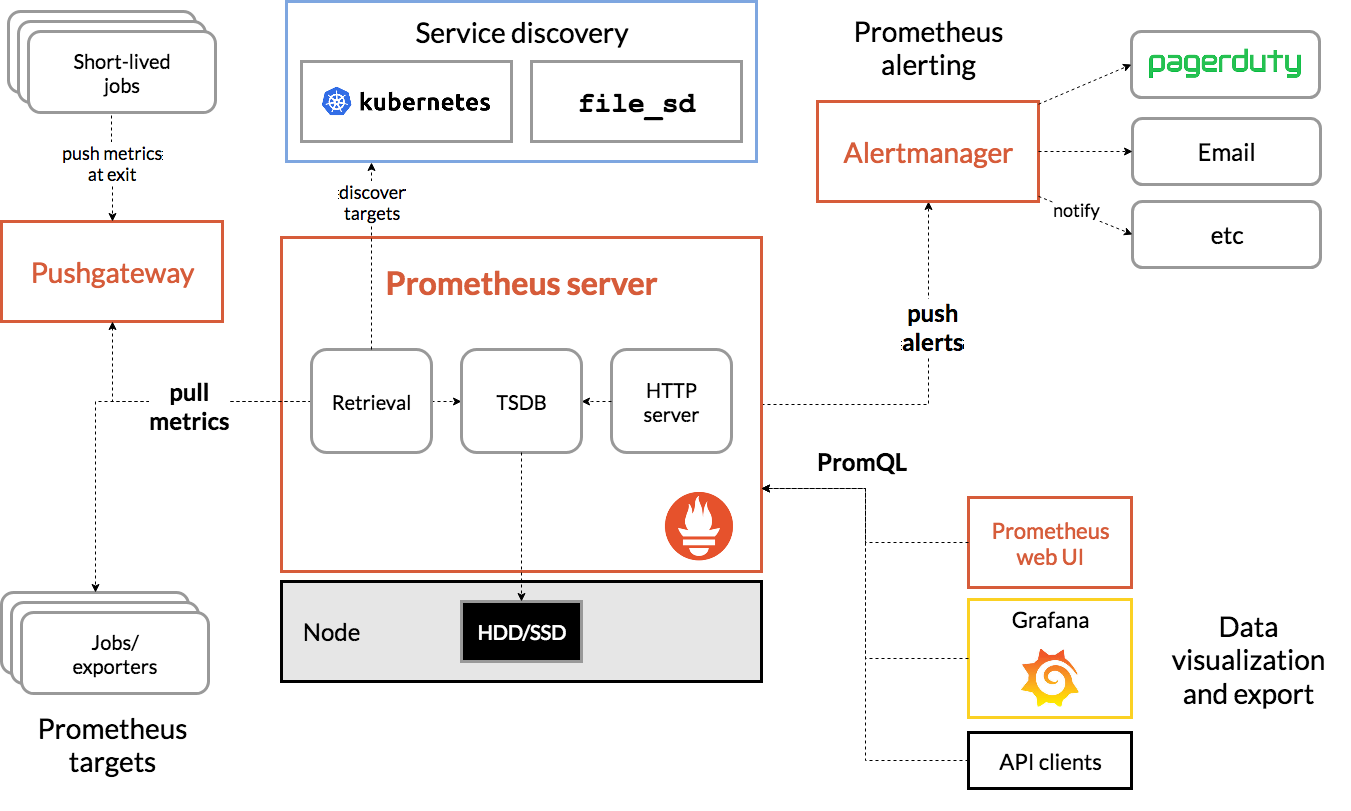
Prometheus servers have the following assignments:
- Periodically scrape and store metrics from instrumented jobs, either directly or via an intermediary push gateway for short-lived jobs.
- Run rules over scraped data to either record new timeseries from existing data or generate alerts.
- Discovers new targets from the Service discovery.
- Push alerts to the Alertmanager.
- Executes PromQL queries.
Prometheus Targets⚑
Prometheus Targets define how does prometheus extract the metrics from the different sources.
If the services expose the metrics themselves such as Kubernetes, Prometheus fetch them directly. On the other cases, exporters are used.
Exporters are modules that extract information and translate it into the Prometheus format, which the server can then ingest. There are several exporters available, for example:
- Hardware: Node/system
- HTTP: HAProxy, NGINX, Apache.
- APIs: Github, Docker Hub.
- Other monitoring systems: Cloudwatch.
- Databases: MySQL, Elasticsearch.
- Messaging systems: RabbitMQ, Kafka.
- Miscellaneous: Blackbox, JMX.
Pushgateway⚑
In case the nodes are not exposing an endpoint from which the Prometheus server can collect the metrics, the Prometheus ecosystem has a push gateway.
This gateway API is useful for one-off jobs that run, capture the data, transform that data into the Prometheus data format and then push that data into the Prometheus server.
Service discovery⚑
Prometheus is designed to require very little configuration when first setup, and was designed from the ground up to run in dynamic environments such Kubernetes. It therefore performs automatic discovery of services running to try and make a “best guess” of what it should be monitoring.
Alertmanager⚑
The Alertmanager handles alerts sent by client applications such as the Prometheus server. It takes care of deduplicating, grouping, and routing them to the correct receiver integrations such as email, PagerDuty, or OpsGenie. It also takes care of silencing and inhibition of alerts.
Data visualization and export⚑
There are several ways to visualize or export data from Prometheus.
Prometheus web UI⚑
Prometheus comes with its own user interface that you can use to:
- Run PromQL queries.
- Check the Alertmanager rules.
- Check the configuration.
- Check the Targets.
- Check the service discovery.
Grafana⚑
Grafana is the best way to visually analyze the evolution of the metrics throughout time.
API clients⚑
Prometheus also exposes an API, so in case you are interested in writing your own clients, you can do that too.